Hamza Nouman
REALTOR® · Investment Property Specialist · Cityscape Real Estate Ltd.
The Three Numbers That Make or Break Your Mississauga Investment
Every successful real estate investor in Mississauga speaks three languages fluently: cap rate, cash flow, and ROI. Yet I see new investors confuse these metrics constantly, leading to poor investment decisions in our competitive 2026 market.
Let me break down each metric with real Mississauga examples, so you can evaluate properties like a pro.
Understanding Cap Rate: Your Property's Earning Power
What Cap Rate Actually Measures
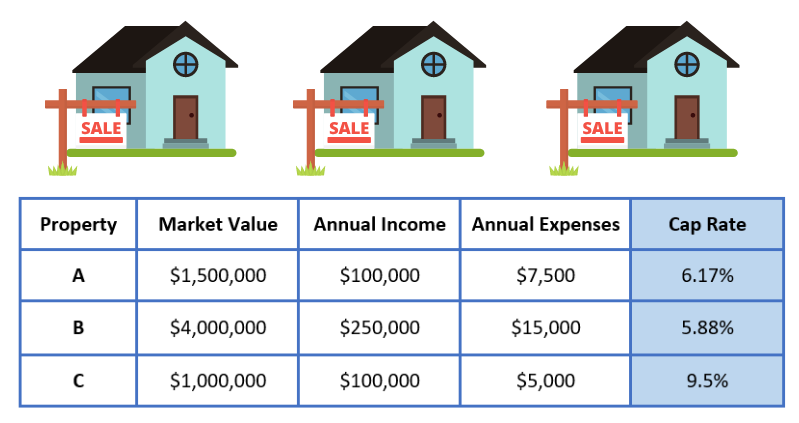
Capitalization rate shows how much income a property generates relative to its purchase price, assuming you bought it with cash. It's calculated as:
Cap Rate = Net Operating Income ÷ Property Value
Think of it as your property's "interest rate" if it were a savings account.
Real Mississauga Cap Rate Example
Take a 2-bedroom condo in Square One area selling for $750,000 in March 2026. It rents for $2,800 monthly ($33,600 annually). After property taxes ($4,200), maintenance fees ($3,600), insurance ($800), and vacancy allowance ($1,680), your net operating income is $23,320.
Cap Rate = $23,320 ÷ $750,000 = 3.11%
This 3.11% cap rate is typical for prime Mississauga locations in 2026, where appreciation potential often matters more than immediate returns.
Why Cap Rates Matter in 2026
Cap rates help you compare properties across different price points and locations. A $450,000 townhouse in Malton with a 5.2% cap rate might generate better immediate returns than that Square One condo, even though the absolute dollar amounts differ.
Cash Flow: Your Monthly Reality Check
The True Cost of Ownership
Cash flow measures actual money in your pocket each month after ALL expenses, including mortgage payments. This is where many investors get surprised.
Monthly Cash Flow = Rental Income - (Mortgage + Taxes + Insurance + Maintenance + Vacancy Reserve)
Mississauga Cash Flow Reality
Using that same Square One condo with 20% down ($150,000) and a $600,000 mortgage at 6.8% (current 2026 rates):
- Monthly rental income: $2,800
- Mortgage payment (25-year amortization): $2,891
- Property taxes: $350
- Maintenance fees: $300
- Insurance: $67
- Vacancy reserve: $140
Monthly cash flow: $2,800 - $3,748 = -$948
This property is cash flow negative by nearly $1,000 monthly. Many Mississauga investors accept this in 2026, betting on appreciation to compensate.
When Negative Cash Flow Makes Sense
As I often tell my clients at MississaugaInvestor.ca, negative cash flow isn't automatically bad if:
- You can comfortably cover the shortfall
- The property appreciates faster than your carrying costs
- Tax benefits offset some losses
- You're building equity through mortgage paydown
ROI: Your Complete Investment Picture
Total Return on Investment
ROI captures everything: cash flow, appreciation, mortgage paydown, and tax benefits. It's the most comprehensive metric.
ROI = (Annual Cash Flow + Appreciation + Principal Paydown + Tax Savings) ÷ Initial Investment
Complete Mississauga ROI Calculation
For our Square One condo example, assuming 4.5% annual appreciation (Mississauga's 2025-2026 average):
- Annual cash flow: -$11,376
- Property appreciation: $33,750 (4.5% of $750,000)
- Mortgage principal paydown: $8,420
- Tax savings (estimated): $3,500
- Total annual return: $34,294
- ROI on $150,000 down payment: 22.9%
Sudenly, that cash flow negative property delivers strong returns through appreciation and equity building.
Comparing Metrics Across Mississauga Neighbourhoods
Port Credit vs Meadowvale: A Tale of Two Strategies
In Port Credit, a $680,000 condo might offer:
- Cap rate: 3.8%
- Monthly cash flow: -$650
- Expected ROI: 18.5%
Meanwhile, in Meadowvale, a $520,000 townhouse could provide:
- Cap rate: 4.9%
- Monthly cash flow: +$180
- Expected ROI: 16.2%
Port Credit offers higher total returns but requires monthly contributions. Meadowvale provides immediate cash flow but lower overall returns.
Which Metric Matters Most in 2026?
Your Investment Stage Determines Priority
New investors should prioritize cash flow. You need properties that pay for themselves while you learn the business.
Experienced investors with strong cash reserves can focus on ROI, accepting negative cash flow for superior total returns.
Retirement-focused investors want steady cash flow over appreciation potential.
Market Conditions Matter Too
In Mississauga's current seller's market, cap rates remain compressed below 4% in prime areas. Smart investors are:
- Accepting lower cap rates in appreciating neighbourhoods
- Focusing on properties with rent increase potential
- Calculating ROI over 3-5 year holding periods
Common Calculation Mistakes to Avoid
The "Gross Rent Multiplier" Trap
Never use gross rental income for cap rate calculations. Always subtract operating expenses first.
Forgetting Vacancy Allowance
Even excellent Mississauga properties average 5-7% vacancy annually. Budget accordingly.
Ignoring Capital Expenditures
Budget 1-2% of property value annually for major repairs and upgrades.
What This Means for Mississauga Investors
Understanding these three metrics transforms you from a speculator into an investor. Cap rates help you compare opportunities. Cash flow shows monthly reality. ROI reveals total investment performance.
In Mississauga's 2026 market, successful investors use all three metrics together. A property with a 3.5% cap rate and negative $800 monthly cash flow might still deliver 20%+ ROI through appreciation and equity building.
The key is matching your investment strategy to your financial situation and goals. Use MississaugaInvestor.ca's deal scores to quickly evaluate properties across all three metrics, helping you identify the best opportunities in today's competitive market.
Need help with this topic?
Book a free 15-minute investor call with Hamza. No obligation — we'll walk through your numbers together.
★★★★★ 5.0 on Google · 28 Reviews
Related Guides
Get the Top 5 Deals Every Week
Join 200+ Mississauga investors who get our free weekly deal breakdown — scored, analyzed, and ranked.